Main Style Chart with Population Details
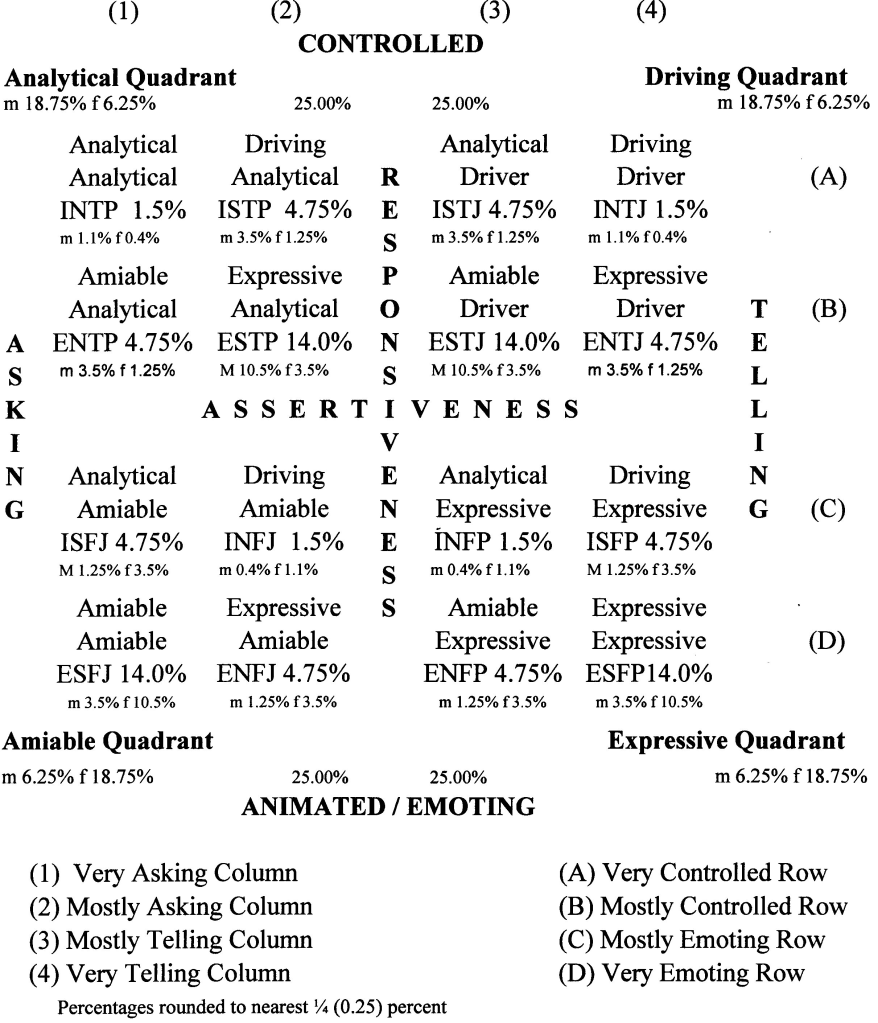
This chart presents a visual view of four quadrants including the various types in their respective positions. The position of each type within the quadrant provides additional information with the words “mostly” or “very” added to two elements creating the complete style position and name. The Percentages shown are theoretical numbers based upon genetic relationships found between the various elements making up the MBTI types. These elements are “E” is dominant and “I” recessive, “S” applicable to all, but “N” being recessive (with its dominant partner not being identified by either Jung or Myers-Briggs team), “T” dominant and “F” recessive for males, “F” dominant and “T” recessive for females, and “J” and “P” being determined by a gene switch (which appears to inheritable as well). The ratio between dominant is 75% dominant and 25% recessive. Because of “T” and “F” differences the two sexes, sex is a component of type as well. The percentages in larger script are for males and females combined. The smaller script beneath each type give the breakdown between males and females. These percentages are rounded to the nearest quarter percent except for the four numerically smallest types which are rounded to the nearest tenth percent.) For more information about these numbers, see “The Genetics of Psychological Type” by Norbert Grygar available on smashwords.com or amazon.com in the books section.
This page is important because it shows that there are four degrees of asserting our needs with ranges from very asking to mostly asking to mostly telling to very telling and four responsiveness levels with ranges from very controlled to mostly controlled to mostly animated to very animated. And, if you are in one of the numerically small types, it helps you to understand why persons like yourself are in short supply.
You can choose to print a copy of this chart by pressing the button below:
